The invisible cost of poor digital experience: what happens when your company does not have DEX data
Your sales team missed an important meeting because a laptop froze in the middle of the presentation. The finance team recreated a spreadsheet three times because Excel closed by itself. None of these incidents became a ticket. None were recorded. But both cost money.
Most companies measure IT health through technical indicators: servers up, systems online, tickets resolved. The problem is that these indicators do not capture what happens in the daily routine of the people who actually use technology to generate revenue.
This article shows what the lack of visibility into digital experience costs two departments that directly impact revenue — Sales and Finance — and how data such as CPU and memory usage reveals what no ticket shows.
What the industry already knows about the cost of digital friction
Before getting into specific departments, it is worth putting the scale of the problem into context.
HappySignals’ Global IT Experience Benchmark 2025 — based on 2.28 million employee responses across 130+ countries — reveals that each IT incident costs, on average, €160 (~R$960) in lost time, with employees reporting a loss of 3.22 hours of productivity per incident while waiting for resolution.
The most critical data point for this article: 13% of tickets are responsible for 80% of all productivity loss. In other words, a small fraction of incidents concentrates the greatest negative business impact — and often goes unnoticed by traditional IT.
In addition, each ticket reassignment lowers user satisfaction by 8 points and costs an additional 2 hours of productivity, showing how inefficient internal processes amplify digital friction.
And the problem is even bigger than the numbers suggest: most negative digital experiences never reach the service desk, remaining invisible to IT until they become critical incidents or directly affect retention and engagement.
Sales: when a slow laptop costs the commission
What happens without DEX data
A salesperson who loses 2 to 10 hours per week waiting for a laptop to respond is not just losing time. They are missing opportunities to prospect, close deals, and build customer relationships.
Worse: when the problem is device slowness, the salesperson rarely opens a ticket. They simply adapt — they get coffee while Windows starts up or restart Teams before the next call. The behavior becomes invisible to IT.
What the data reveals about the “Sales” group
With a DEX solution like Collective IQ®, IT can group devices by department and view specific metrics. A typical scenario for the “Sales Team” group may show:
A typical scenario for the “Sales Team” group may show a device with 86% memory usage. This indicator represents a high level of memory utilization and can be classified as high according to the criteria defined in DEX. The table may show, for each team, the service or application name, the consumption percentage, and its respective classification — low, medium, or high.
With Collective IQ’s Experience Score, IT can identify the experience level of the “Sales” group and observe the indicators that contribute to that classification. For example, a group may show a “Frustrating Experience” score from 1 to 3 associated with low device performance indicators. With this information, IT can identify the groups or devices that require the most attention and define targeted improvement actions, reducing the risk of a frustrating experience for users.
Finance: when freezing affects closing
What happens without DEX data
The finance team works daily with heavy spreadsheets, ERP systems, and reconciliations that require absolute precision. When a computer freezes in the middle of a complex calculation, the impact is not only on time — it is on reliability.
Tools like Excel use computer resources to perform their operations. When available memory is low or free disk space is insufficient, the device may have limitations when performing certain tasks or saving new files. In these scenarios, the team may need to adapt its routine, for example, by avoiding keeping too many files and applications open at the same time or freeing up space to continue working normally.
What the data reveals about the “Finance” group
A typical scenario for the “Finance Team” group may show a device with 85% of its storage space used. This indicator represents a high level of storage utilization and can be classified as high according to the criteria defined in DEX. Based on this data, IT can identify which teams have higher storage utilization and which devices have less free space available, making it possible to target actions to free up space or expand capacity when necessary.
The real cost to the business
Delays in financial closing have cascading consequences: delayed management reports, postponed investment decisions, and compromised cash flow.
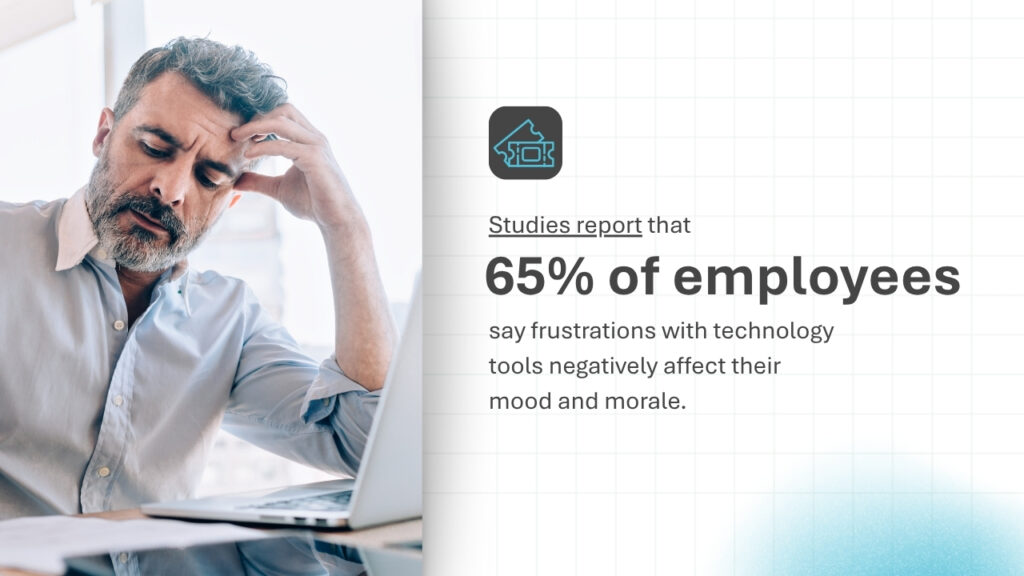
In addition, the accumulated stress of dealing with tools that do not work affects team morale. Studies report that 65% of employees say frustrations with technology tools negatively affect their mood and morale.
With DEX data, IT can also monitor the Experience Score of the “Finance” group and check its experience classification, connecting it to the indicators available in the environment. This makes it possible to identify improvement opportunities without attributing storage alone to a cause that is not directly proven by the metric.
What changes when IT has visibility by group
The fundamental difference is this: instead of waiting for a ticket, IT sees the problem in the group before it becomes a request.
Collective IQ® groups data by department, allowing IT to tell the sales director: “Your team has 86% memory usage. This means each salesperson loses about X minutes per day waiting for the computer. If we fix this, that is Y hours recovered per month — and Z in potential sales.”
With CIQ DEX, IT can organize devices by department and also create custom groups of machines, making it possible to analyze the digital experience of specific segments of the environment according to operational needs.
And the results are measurable: up to 30% less incident resolution time and a significant reduction in help desk costs.
Conclusion: the problem is not technology. It is the lack of visibility into it.
Sales and Finance are just two examples. Any department that depends on devices to generate revenue or maintain critical operations is subject to the same invisible cost.
The question is not whether your company has digital experience problems. It is how many of them you still cannot see. And how much it is costing not to see them.
Want to discover what DEX data reveals about your Sales and Finance departments?
Contact the Almaden team and schedule a Collective IQ® demo.